
Every sensor on one screen
Thousands of sensors are spread across the site, the team looking after them is small, and nobody can watch readings around the clock. The IoT system brings every value onto one screen, watches them in place of a person, raises an alert when something is off, and keeps the history for later analysis.
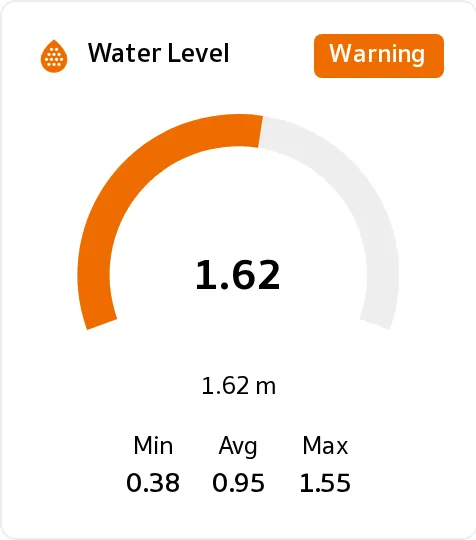
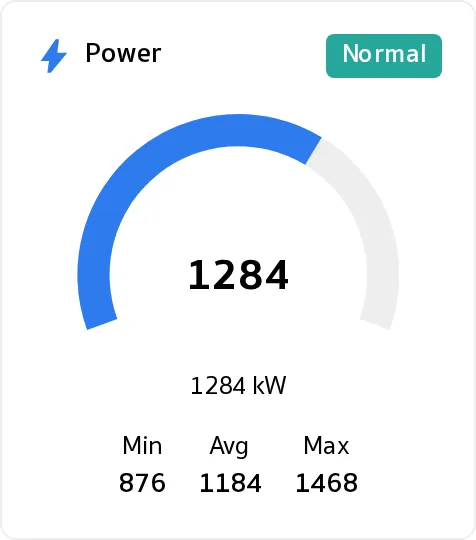
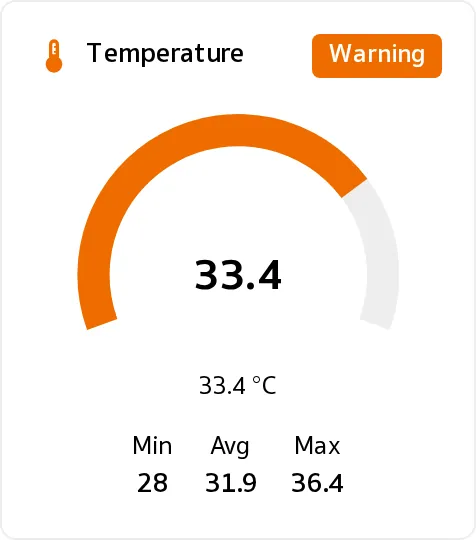
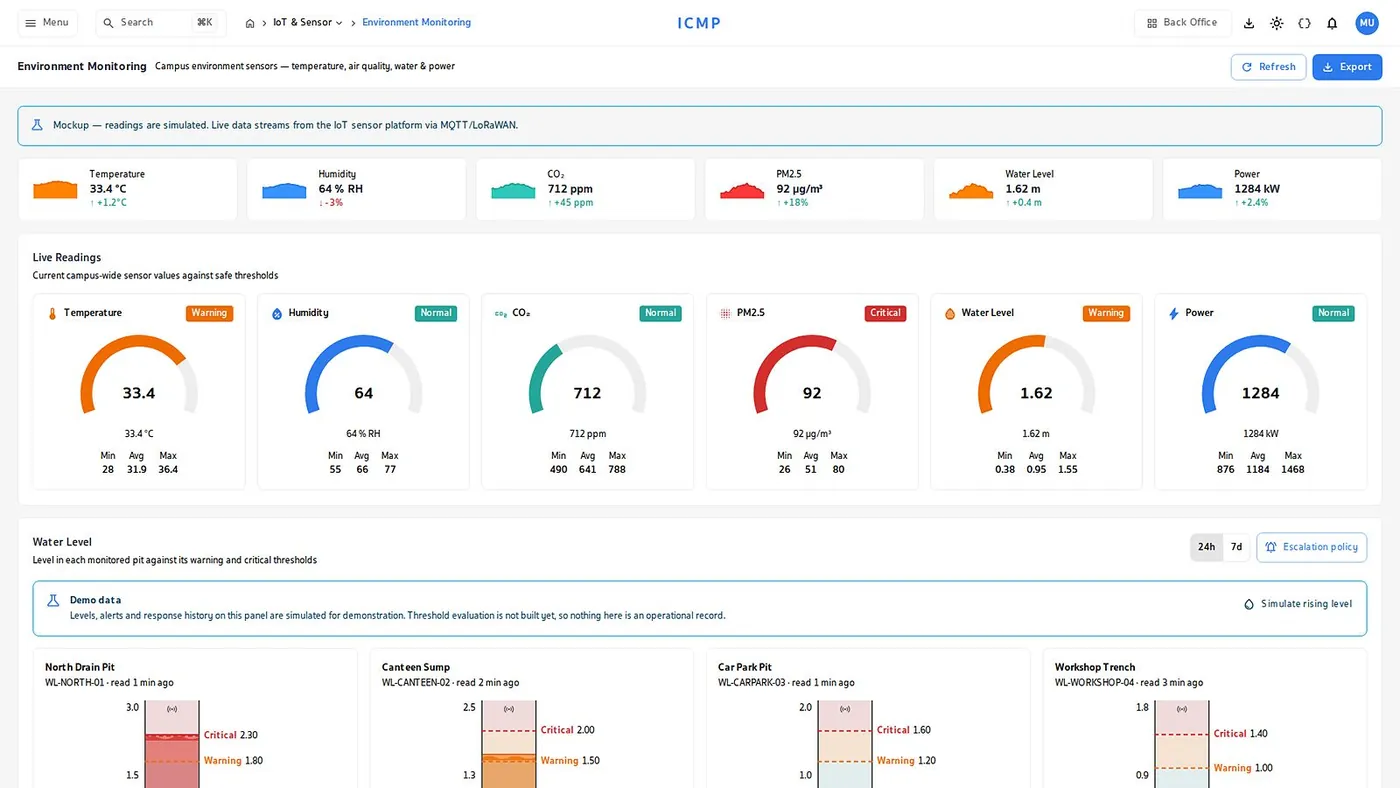
The whole site summarized on one screen
Temperature, humidity, dust, water level and power draw appear as gauges with the latest value, the minimum and maximum and a trend line. Status is split three ways, normal, warning and critical, on thresholds you set per point.
- Drill from the overview to one sensorClick a category to see the individual sensors and the history of that point.
- Dashboards for real locationsPump rooms, electrical rooms or rooftops. Build a view for one specific area.
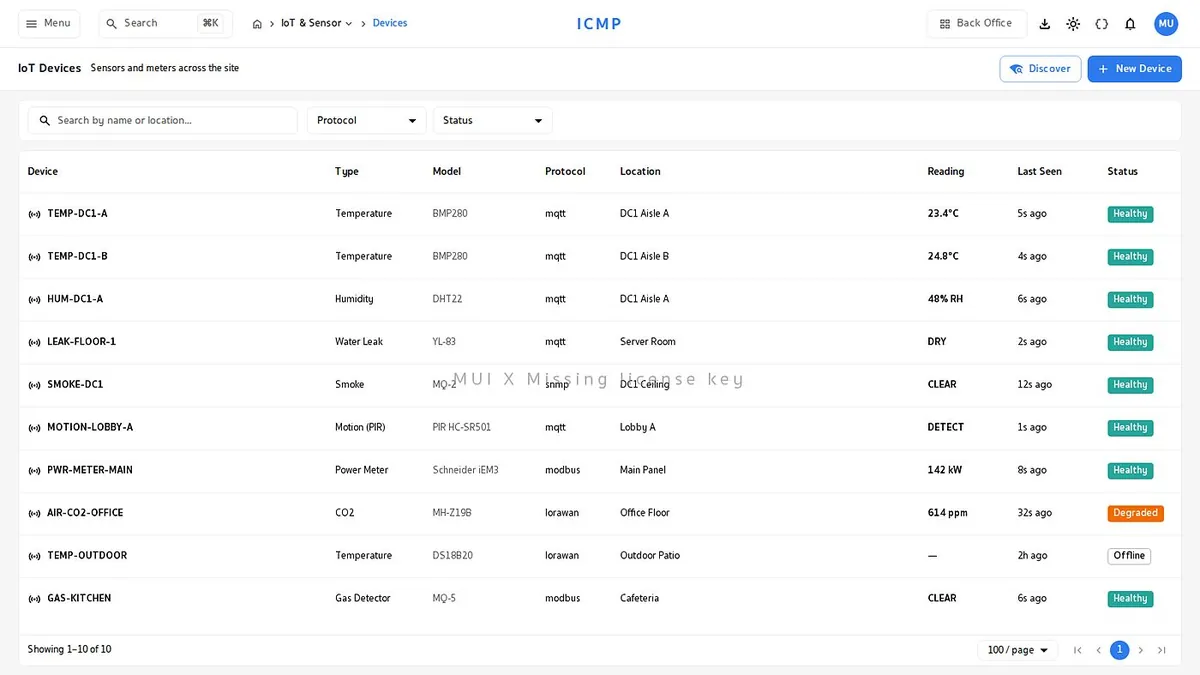
A sensor register with health for every unit
Tens of thousands of sensors can be registered per system, with type, location, protocol and the time of the last reading.
- Know immediately which unit stopped reportingA sensor that dies quietly is more dangerous than one reporting a wrong value, because nobody realizes that point is no longer being watched. Data freshness is tracked for every unit and a lost connection shows as a status the moment it happens.
- Import hundreds at a timeRegister with a CSV file and get a result report of how many succeeded and how many were duplicates.
- Group by locationSplit by building, floor or zone, then search and edit as a group.
- Ten sensor typesTemperature, humidity, dust, water leak, smoke, motion detection, power meters and more.
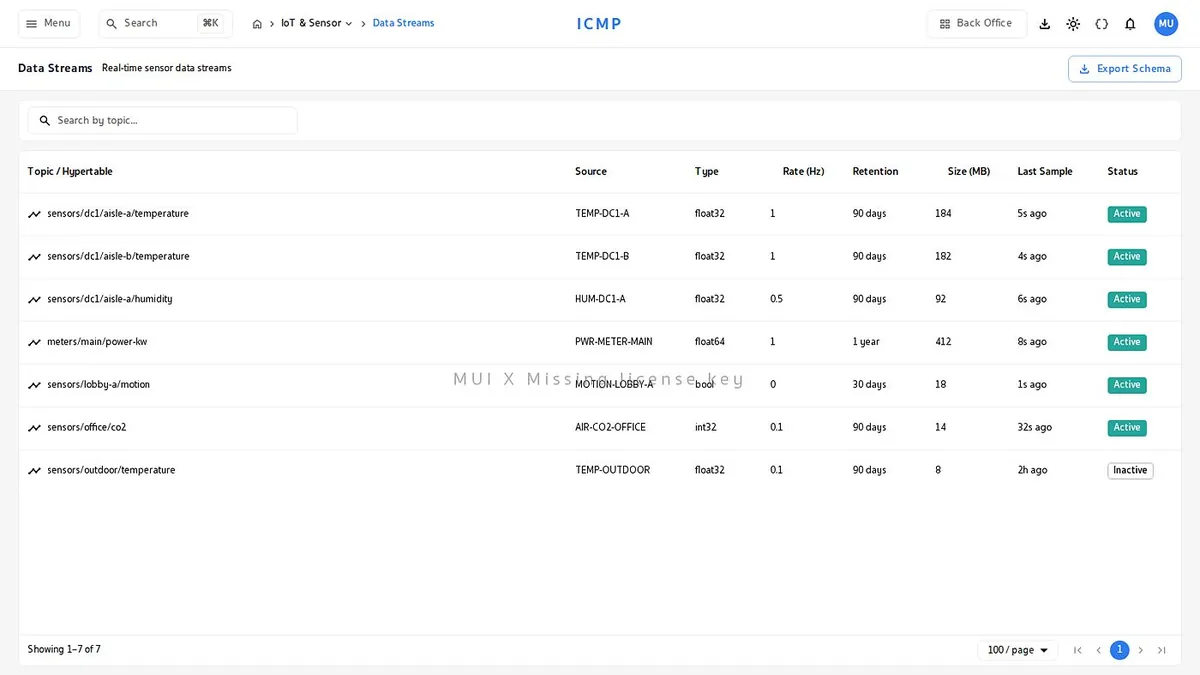
Historical charts, deep into any value
Every point is stored as a time series, in full detail for 30 days and as hourly summaries for one continuous year, so you can open several sensors on the same time axis.
- Compare several points at onceOverlay the temperature charts of several rooms to find the one behaving differently.
- Pick the window around an alert and follow how each value moved before it happened.
- Export to a filePull the range you need as CSV for reporting or analysis.
If the network drops, readings buffer on site and are sent back once the link returns, so the historical chart has no holes in it.
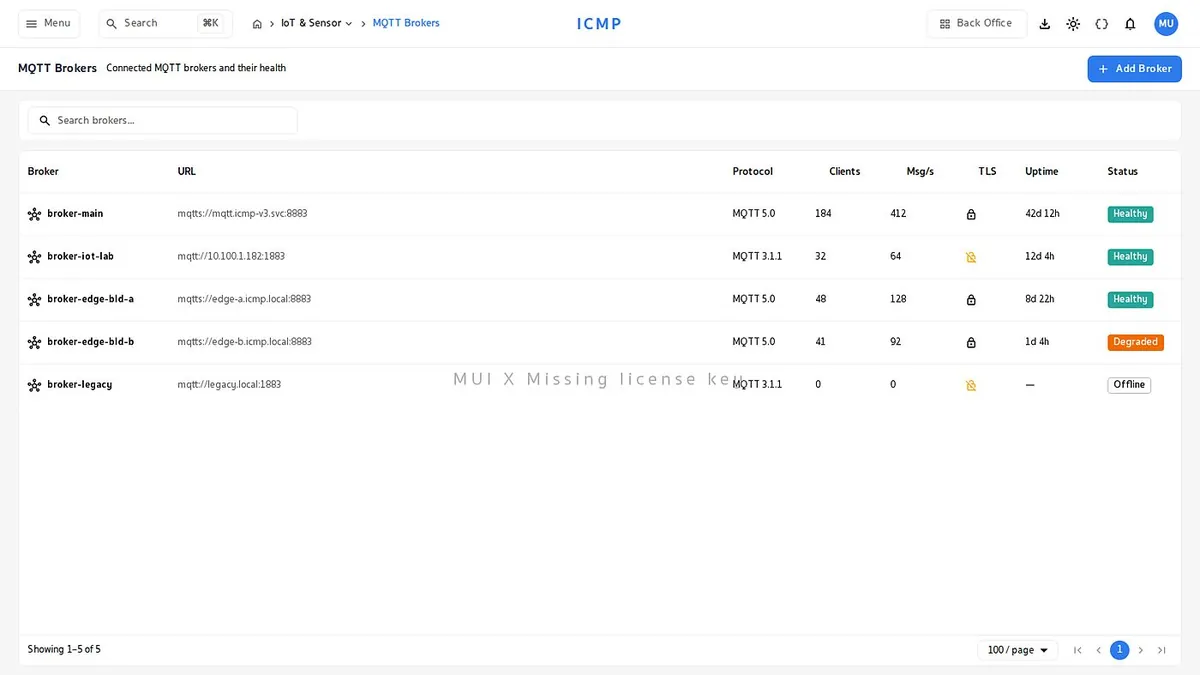
Every major protocol, no vendor lock-in
MQTT, SNMP, Modbus, BACnet, OPC UA and LoRaWAN all connect into the same system. Devices that speak different languages are normalized into one set of data, so existing sensors keep working and new ones can come from whichever vendor makes the most sense.
- Gateways fail over on their ownIf the primary gateway goes down, the system switches to the standby within seconds, with no reconfiguration.
- Connection status monitoringSee whether each gateway is online and how much data it is moving.
- EV chargers supportedTake energy, voltage and connector status through the OCPP standard.
Alerts smarter than a simple threshold
Threshold plus duration
Set how long a value has to stay out of range before it alerts, which cuts the noise.
Test a rule before it goes live
Simulate sensor values to confirm a rule behaves as expected before switching it on.
Every rule firing is logged
The time, the value that triggered it and the notification result, all auditable.
Multiple notification channels
Email, SMS, or raised as an event in the platform alarm center.
Extend into automation
A leak closes a valve, an overheat starts a fan. Rules connect into the automation engine.
Shared with DCIM and building systems
The same sensors feed the IoT dashboard, the server room and building operations.