
Data center visibility down inside the rack
Your server room becomes a 3D model that matches the real thing. Look at the whole room, drill into a cabinet, then down to one device, with power, cooling and capacity data on the same screen.
Walk the room from your desk
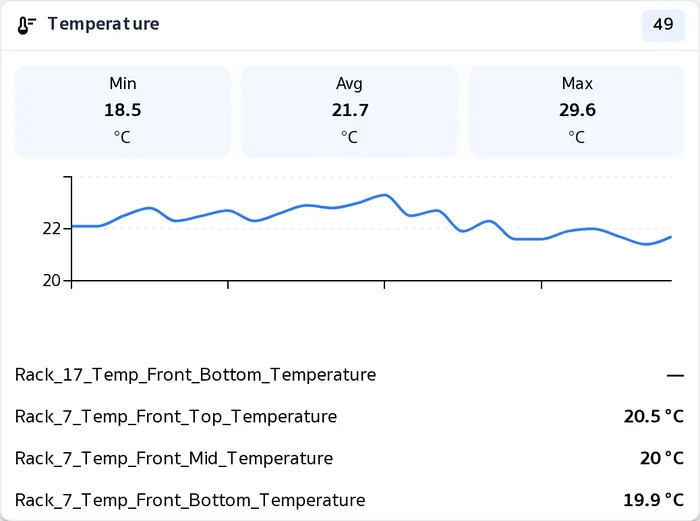
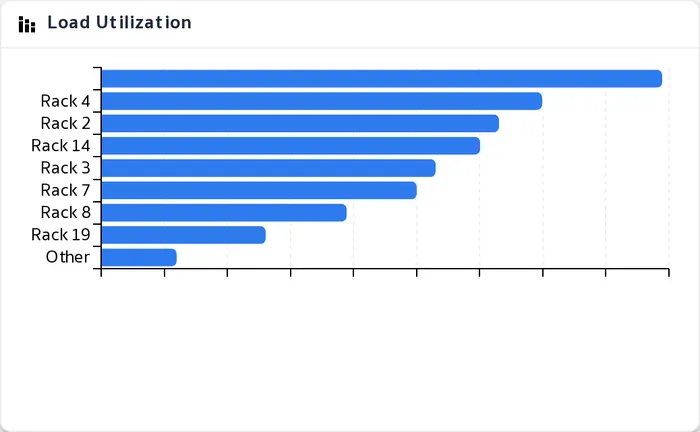
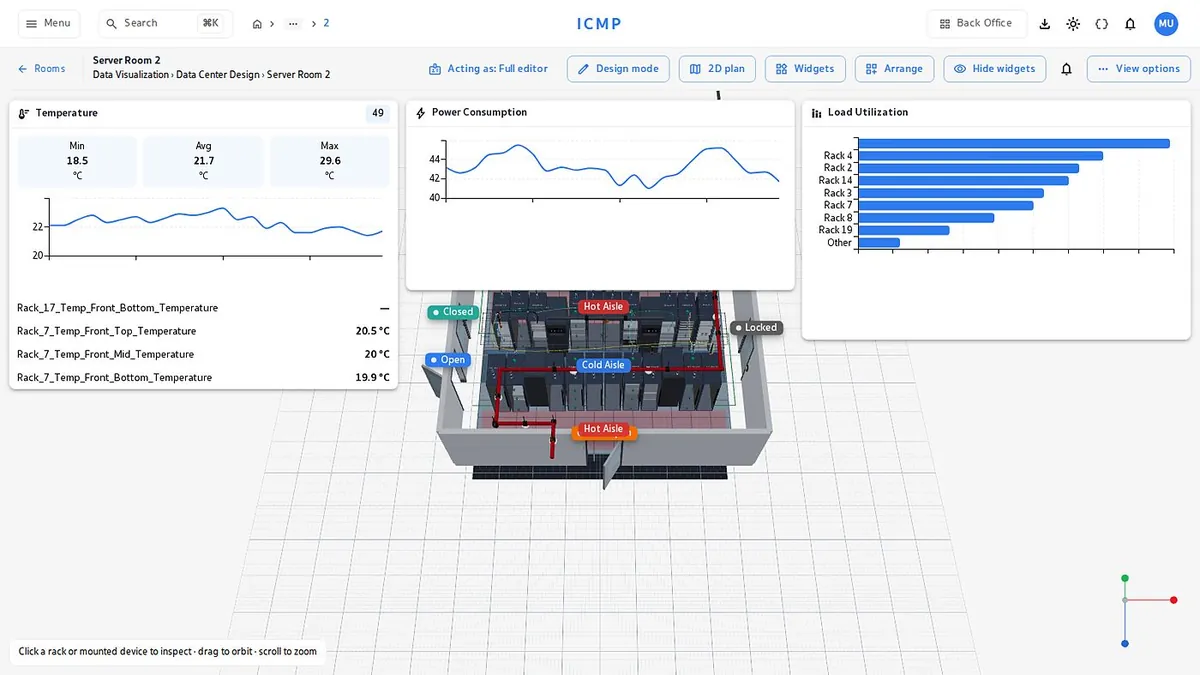
The 3D model places racks, pipes and sensors where they really stand, and turns in any direction, with temperature, power draw and load per rack charting alongside it on the same screen.
- Hot and cold aisles at a glanceSee the hot aisle and the cold aisle on the model, along with door and fire suppression status.
- See through the cabinetInspect the gear inside without opening the door, so field teams find things faster.
- Edit the layout by draggingThe 3D editor draws walls, places cabinets and moves racks, with 100 undo steps.
From the whole room you click into a cabinet and then down to an individual device in a few clicks. It is the same path a field team already thinks in, not a menu to memorize.
Open a cabinet U by U without walking to the rack
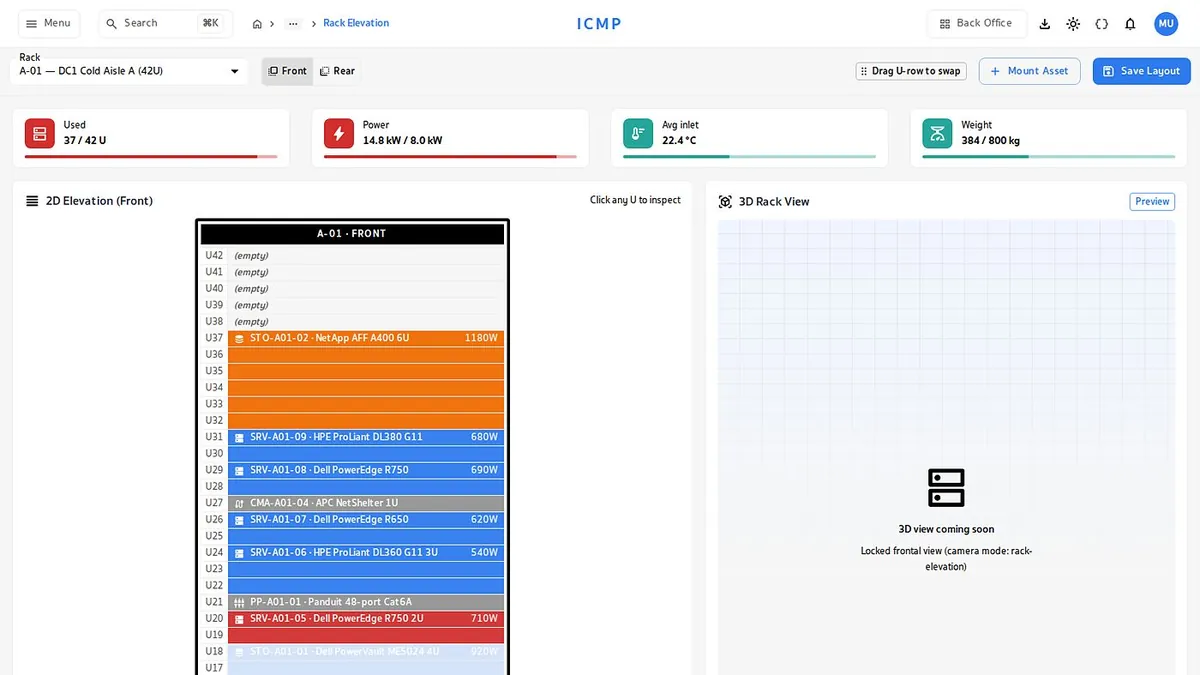
Rack Elevation shows every device in its U position, in both 2D and 3D, with the free space left, the accumulated weight and the power budget of that cabinet.
- Know how many U are leftFree space for every cabinet sits in one table, so you can plan a new install right away.
- No overlapping placementsThe system checks U conflicts before saving, and warns when the weight or the power of a cabinet reaches 90 percent.
- Reserve U in advanceHold space for an incoming project so another team cannot take it.
- Device model catalogPick a model from the catalog and the dimensions and weight fill in for you.
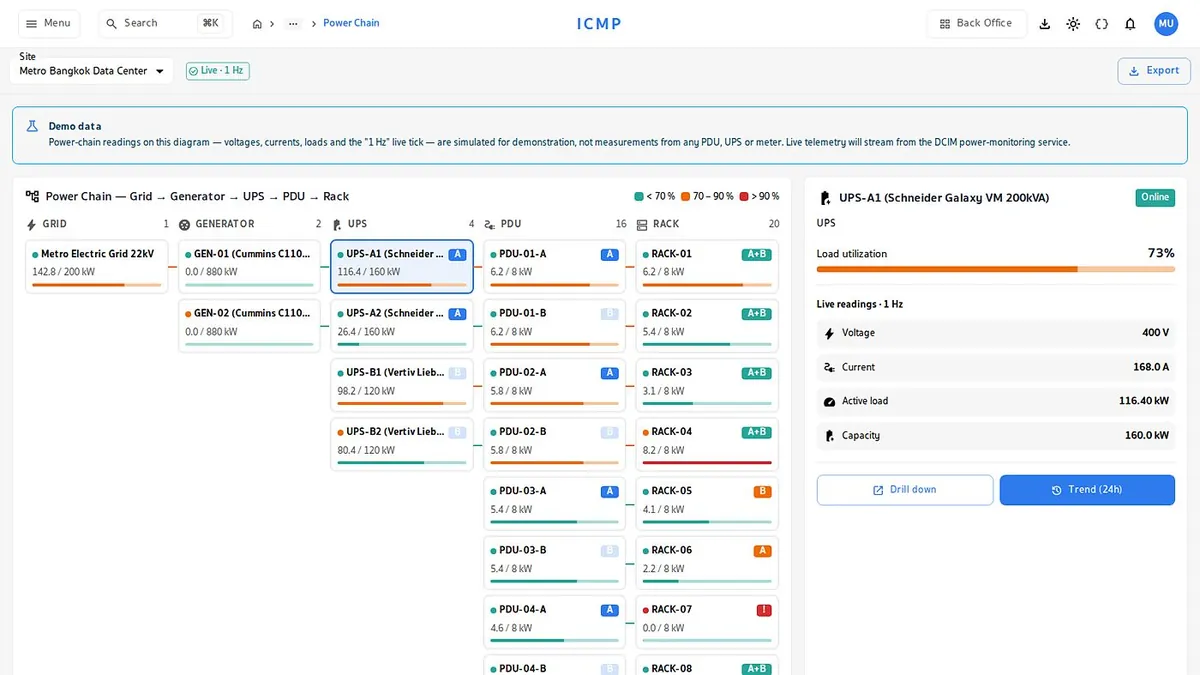
The full power path, from source to server
The hardest question during a power problem is which breaker this machine draws from. The power path diagram answers it from the grid through UPS and PDU down to the rack, with live load at every point.
- Phase imbalance alertsYou hear about it the moment three-phase load drifts past the limit, before damage happens.
- UPS battery healthA health score per unit, with a recommended replacement date set ahead of time.
When power has to come down for maintenance, the team knows in advance which machines go dark with that breaker, instead of finding out when somebody calls to say a system is down.
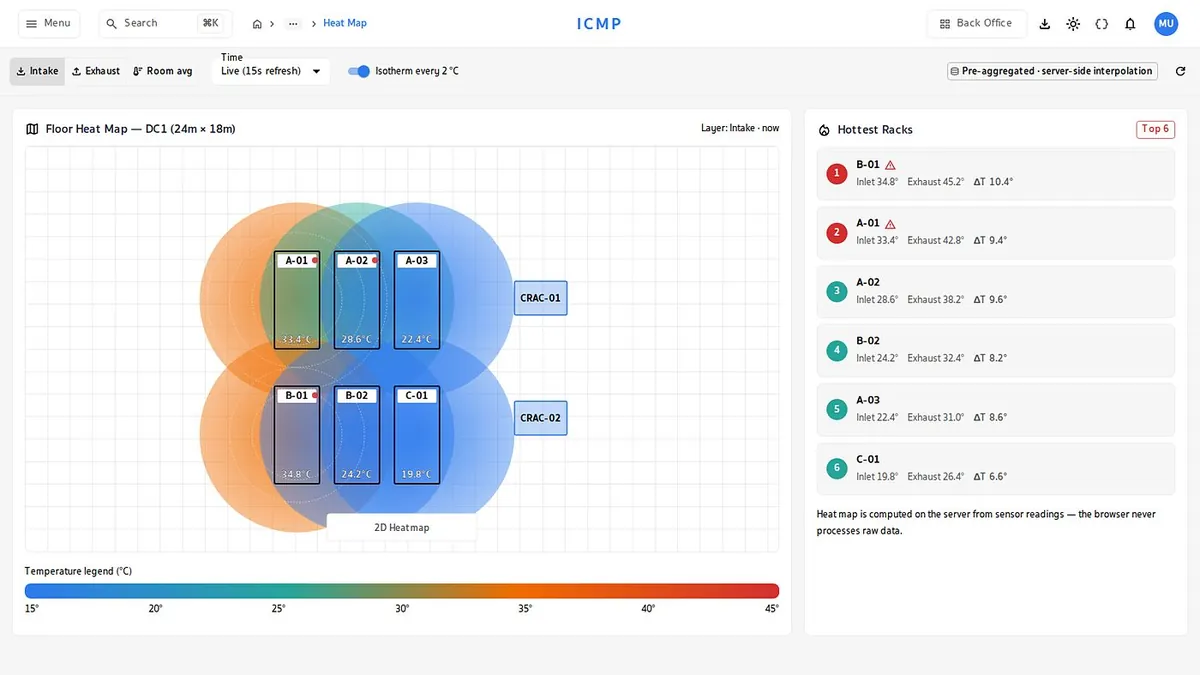
A heat map that shows the risk before a shutdown
Temperatures from every sensor draw a live heat map over the floor plan, shaded by real values, so building hot spots are obvious in a second.
- Temperature history per pointHistorical charts for each sensor help you trace the cause of heat build-up.
- Alerts on your thresholdsTemperature, humidity, water leak or smoke past the limit raises an alert immediately.
- Catch cooling units fighting each otherDetect air conditioners with conflicting setpoints that waste power.
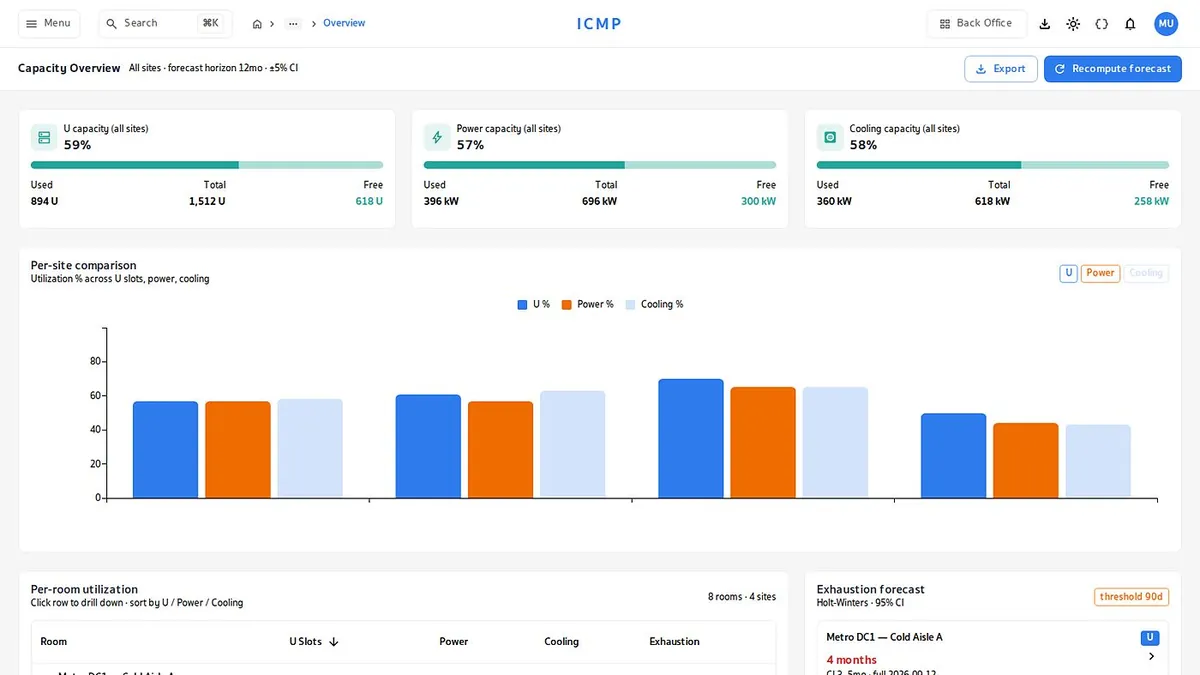
Know when you will run out, before you do
The capacity page brings U space, power and cooling for every room together and lines them up until the real bottleneck shows, because a room with plenty of space but no power left still cannot take another machine.
- Historical usage trendsResource usage over time gives you the growth rate.
- Test a scenario before you buyModel one more deployment. Which room takes it, and does the power hold.
- Standard reports ready to goPUE, ASHRAE and ISO 30134, exported as PDF or CSV.
Covering the full data center lifecycle
Cable tracing down to the port
The full cable inventory with routes on the plan, traced from the source port to the far end.
IPAM for IP and VLAN
IP records, prefixes, VLANs and VRFs live with the physical layout in one system.
Direct building system integration
Pull chiller and generator data in over BACnet and Modbus and show it alongside the rest.
Per-tenant power billing
Energy usage summarized by tenant, for colocation operations.
Change requests with a workflow
Moves and installs go through approval, with an impact assessment before the work starts.
Same platform as your cameras and doors
The server room shares cameras, doors and sensors with site-wide security.